Range X-Ray: See Through Your Opponent's Range
📌 TL;DR
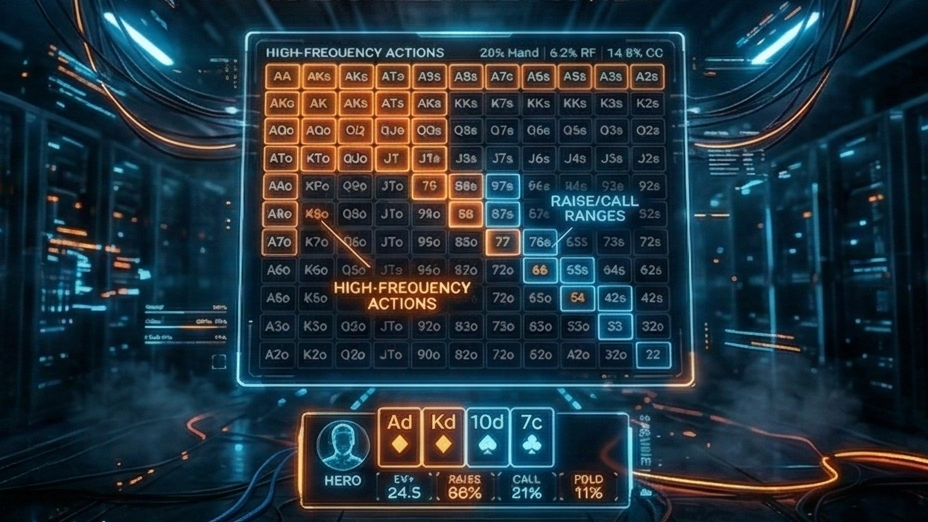
Range X-Ray is your ultimate tool for Population Tendency Exploitation. By clicking any action on the Strategy Matrix, you can instantly break down that specific action into precise hand categories, draw potentials, and showdown performance. Stop guessing if they are bluffing—look at the data.
🩸 The Problem with Traditional HUDs
As poker players, we constantly face situations where logic isn't enough:
- The Sizing Dilemma: A villain fires a massive 150% Overbet on the River. Are they hyper-polarized to the absolute Nuts, or is the population massively over-bluffing this specific sizing?
- The Blind Spot of GTO: Theoretical solvers assume your opponent plays perfectly. But real players don't. Playing GTO blindly against an unbalanced player pool means leaving money on the table.
The Solution: Range X-Ray allows you to dissect the exact hand distribution of the player pool for any micro-context and instantly compare it against the GTO baseline to extract maximum EV (Maxploit).
⚙️ How do we Understand the Game
Range X-Ray delivers Zero-Latency data visualization across three core dimensions:
1. Hand Classes (Strength Distribution)
Every possible holding is categorized into 14 precise tiers (from Full House+ down to Bottom Pair and Air).
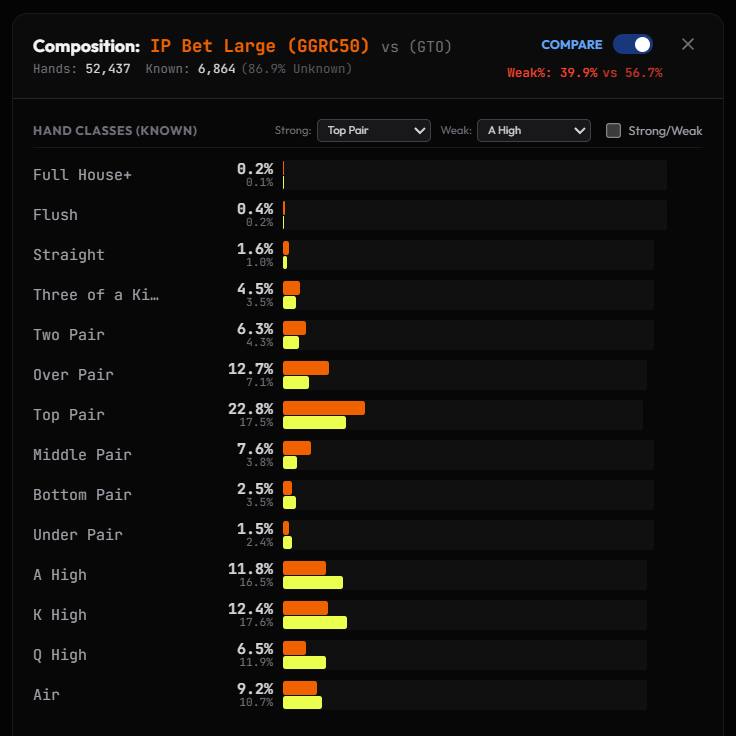 CO/BTN vs BB SRP Flop IP Bet Large Hand Classes
💡 Maxploit Pro-Tip (Strength Mode): Too much noise? Toggle Strong/Weak mode. Maxploit instantly aggregates the 14 tiers into Strong, Marginal, and Weak sections. You can even customize the exact threshold tailored to the board texture.
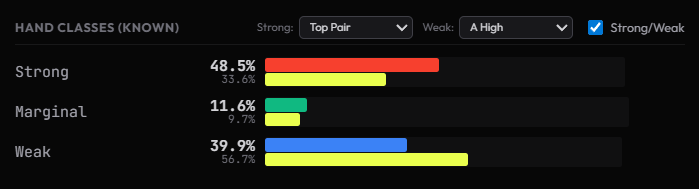 Strength Mode clearly shows how value heavy is the population's betting range in this node
2. Draw Classes (Semi-Bluff Mapping)
Bluffs aren't just pure air. We expose the exact drawing composition behind any bet or raise, tracking Flush draws, 8-out straight draws, and high-equity Combo draws. Understand exactly what kind of equity the pool relies on when they fire.
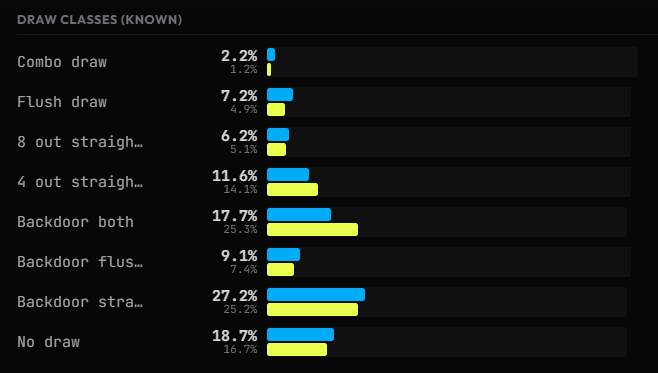 Population is slightly weighted towards front-door equity draws here
3. Showdown Outcomes
Instantly gauge the profitability of an action. The distribution is split into WonSD (Won at Showdown), LostSD, WonNoSD (Player folded out opponents) and LostNoSD.
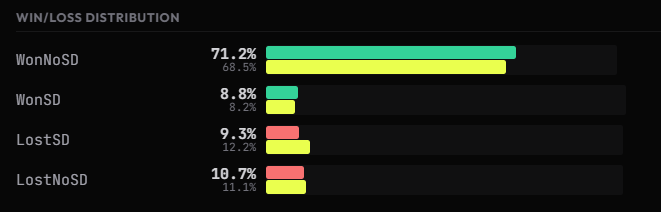 Even population's BB defends roughly GTO on the flop, the IP aggressor seems to get fold equities on later streets more often.
🔬 Deep Context Filtering
What makes Range X-Ray unprecedented is how specifically the data is filtered. We don't just show you generalized "Bets":
- Micro-Context Filtering: The data is isolated by Street, IP/OOP positional status, and distinct Bet Size Buckets.
- Aggression Context (
Raised Mode): Wonder how players react when they are bet into and then face a raise? Our engine natively splits regular defense vs bets actions fromFacing Raisecontexts, revealing extreme tendencies in high-stress spots. - Compare Mode: Click the Compare Toggle to overlay theoretical GTO data directly onto the human pool's bar charts. Deviations become instantly visible. You can even compare data between different pools.
💡 Practical Exploit Scenarios 🔥
Case 1: Exploiting the "Over-Bluffer"
SPOT: Facing a 75% Bet from an OOP player on a dynamic Flop.
Compare Mode is enabled. The global Weak% Indicator lights up: The pool's Weak% is at 40%, while GTO suggests it should only be 22%. The Air and Bottom Pair bars vastly outpace the specific GTO reference.
The pool is heavily over-bluffing this specific node. Massively increase your Calling frequency with marginal hands and Float wider to punish their excessive aggression.
Case 2: Escaping the Value-Heavy Raise
SPOT: An IP player surprisingly Check-Raises your Flop C-Bet.
Analyzing the Raise action, the Weak% diff drops deep into the red. Over 85% of their range consists of Two Pair or better. They have almost zero Combo draws or Air.
This is a severely under-bluffed node. Pure GTO might tell you to defend with Top Pair, but Range X-Ray proves it's a statistical blunder. Make an exploitative Hero Fold, saving valuable chips.
Ready to stop guessing and start exploiting? Open the Strategy Matrix, click on any action frequency, and turn on Range X-Ray to visualize your edge.